Explore somewhere else
Sliding Shores
Sliding Shores is a free interactive 3D globe that lets you raise or lower sea level and watch coastlines change. Uncover the ocean floor, flood familiar stretches of land, or turn the globe to see what happens elsewhere. There is no sign-up or score to chase, just a planet to experiment with.
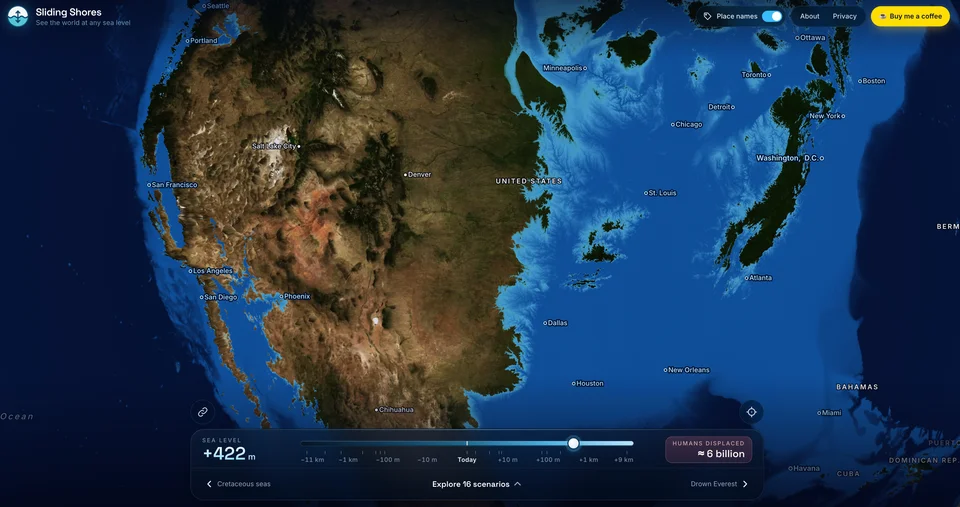
Sliding Shores with sea level raised to +422 m. An exploratory visualization, not a flood forecast.
- Cost
- Free to explore; optional donation
- Devices
- Computer or newer phone; older phones may struggle to load
- Account
- No sign-up needed
- Controls
- Drag to rotate; sea-level slider and scenario shortcuts
- Creator
- Richard Franklin
What can you explore?
Start with a coastline you recognize and move the sea-level slider a little in either direction. The scenario menu offers shortcuts, ranging from familiar coastlines to deliberately impossible extremes.
- Today returns the water to present-day sea level, giving you a baseline for comparison.
- Ice Age lowers the water to reveal land around today’s coasts. Look around Britain and mainland Europe to see the difference.
- Oceans drained exposes the sea floor. Turn toward the Atlantic to explore terrain that is usually hidden underwater.
- Drown Everest takes the idea to an extreme: what would remain above water at the height of the world’s highest mountain?
How do you rotate, zoom and reset the globe?
Drag the globe to look elsewhere, or use the arrow keys when the globe is focused. Scroll or press plus and minus to zoom. On a phone, drag to rotate and pinch to zoom.
Move the sea-level slider to change the water height. To reset the water, open the scenario menu and choose Today. That resets sea level, rather than your viewing angle. Place names can be switched off for a cleaner view, and the optional location button is not needed to explore.
Will it work on your phone?
A newer phone can handle rotating the globe, zooming and moving the sea-level slider. Older phones may struggle to load the 3D globe. If it does not load on yours, try a newer device or a computer.
How accurate is Sliding Shores?
Sliding Shores uses NOAA’s ETOPO 2022 elevation data for land and sea floor. The heights are based on real data, but moving a global waterline is not the same as modeling a flood. It is a geographic experiment, not a local flood forecast.
Historical presets use modern continental positions. The population figure is an estimate of people living below the chosen waterline, not a prediction of how many will have to move. Treat the globe as a starting point for curiosity, not a tool for judging whether a home is safe from flooding.
Why it earns a tab
The changing shoreline is the reward. We like how one simple control makes familiar geography look unfamiliar, without a tutorial or a task list getting in the way. It is a particularly good distraction for anyone who already loses time looking at maps.
Site operated by Richard Franklin.
Find it in Explore somewhere else